Market Outlook
November 01, 2016
Market Cues
Domestic Indices
Chg (%)
(Pts)
(Close)
Indian markets are likely to open positive tracking global cues and SGX Nifty.
BSE Sensex
(0.0)
(11)
27,930
Nifty
(0.1)
(12)
8,626
U.S. stocks closed lower on Monday as the probability of December rate hike
Mid Cap
0.5
65
13,473
increased with new data release as well as election uncertainty weighed on the
Small Cap
1.0
129
13,583
minds of investors. The S&P 500 index slipped 0.26 points to close at 2,126, with
five of the 11 main sectors finishing lower. The Dow Jones Industrial Average
Bankex
(0.1)
(16)
22,368
declined 0.1%, to close at 18,142. Economic data released on Monday (consumer
spending and inflation) is consistent with previous releases suggesting that Fed is
Global Indices
Chg (%)
(Pts)
(Close)
likely to raise interest rates in December.
Dow Jones
(0.1)
(19)
18,142
FTSE 100 shares closed 0.6% lower at 6,954 on Monday as the mood on the bourse
Nasdaq
(0.0)
(1)
5,189
was downbeat. WPP, UK's advertising behemoth, was the biggest riser on the FTSE
FTSE
(0.6)
(42)
6,954
100 said that its UK sales showed slower growth, which could be "the first signs of
Nikkei
(0.2)
(32)
17,394
Brexit anxiety".
Hang Seng
1.1
257
23,192
Markets ended the customary 'Muhurat' trading session to usher in the new year
Shanghai Com
0.1
3
3,104
Samvat 2073 on a negative bias with the broader markets outperforming the
benchmark indices. The S&P BSE Sensex ended down 11 points at 27,930 and the
Advances / Declines
BSE
NSE
50-share Nifty settled 12 points lower at 8,626. In the broader markets, the BSE
Midcap index gained 0.5% and the Small-cap index gained nearly 1% to hit 52-
Advances
2,005
982
week high in intra-day trade
Declines
469
656
Unchanged
205
70
Result Review
Sundaram Finance Q2 profit rises 13.2% to `128cr
Volumes (` Cr)
Nestle India’s Q2 profit more than doubles to `269cr
BSE
862
Detailed analysis on Pg2
NSE
3,462
Investor’s Ready Reckoner
Key Domestic & Global Indicators
Net Inflows (` Cr)
Net
Mtd
Ytd
Stock Watch: Latest investment recommendations on 150+ stocks
FII
(1,109)
(4,122)
45,882
Refer Pg6 onwards
MFs
729
6,016
19,963
Top Picks
Top Gainers
Price (`)
Chg (%)
CMP
Target
Upside
Company
Sector
Rating
(`)
(`)
(%)
Star
1,046
11.3
Amara Raja Batteries Auto & Auto Ancill.
Buy
1,014
1,218
20.1
Iifl
332
7.8
HCL Tech
IT
Buy
764
1,000
30.8
Shriramcit
2,499
7.2
Bharat Electronics
Capital Goods
Accumulate
1,301
1,414
8.7
Equitas Holdings
Financials
Buy
179
235
31.6
Nationalum
53
7.1
Navkar Corporation Others
Buy
199
265
32.9
Cadilahc
423
7.1
More Top Picks on Pg5
Top Losers
Price (`)
Chg (%)
Key Upcoming Events
Previous
Consensus
Vrllog
289
(6.3)
Date
Region
Event Description
Reading
Expectations
Bajfinance
1,073
(2.9)
Nov 01 Euro Zone
Euro Zone GDP s.a. (QoQ)
0.3
0.3
Nov 01 China
PMI Manufacturing
50.4
50.3
Persistent
645
(2.6)
Nov 02 US
FOMC rate decision
0.5
0.5
Sjvn
33
(2.5)
Nov 02 Germany
PMI Manufacturing
55.1
55.1
Icicibank
277
(2.4)
Nov 02 Germany
Unemployment change (000’s)
1.0
(1.0)
As on October 28, 2016
More Events on Pg6
Market Outlook
November 01, 2016
Result Review
Sundaram Finance Q2 profit rises 13.2% to `128cr
Sundaram Finance’s profit rose by 13.2% to `128cr for Q2FY17. The non-banking
financial company’s results included one-time income of `40.6cr on account of
sale of shares in BNP Paribas Sundaram Global Securities. The reported profit was
ahead of consensus of `122.6cr.
Loan disbursements for the quarter rose 6% to `3,177cr while the gross non-
performing assets (NPA) stood at 2.18%. Its net NPA stood at 1% for the quarter.
Its total assets under management, grow to `19,348cr from `17,140cr in the year-
ago period.
Nestle India’s Q2 profit more than doubles to `269cr
Nestle India’s net profit for September 2017 quarter more than doubled signaling
that it has overcome the setback it suffered from a ban on its popular Maggi
noodles last year. Net profit rose to `269.4cr from `124.2cr in the year-ago
quarter. Net sales rose by 35.1% yoy to `2,346.2cr.
The results for the quarter however are not entirely comparable with the results of
the corresponding periods due to the Maggi noodles issue in 2015. In the same
quarter last year, Nestle India could not sell Maggi noodles after the Food Safety
and Standards Authority of India (FSSAI) ordered the company to withdraw the
snack item, which accounted for about 30% of the company’s revenue. The FSSAI
order, which was overturned by the Bombay high court in August 2015, was based
on allegations that Maggi noodles contained monosodium glutamate, and lead in
excess of prescribed limits. In the quarter just gone by, Nestle India’s domestic
market grew 37.9% and exports increased by 5.1%.
The growth was broad-based across categories aided by a spate of innovations
and renovation of over 25 new products launched in the recent past. Company in
a statement said that it is in the leadership position in the instant noodles category,
vindicating consumer confidence and trust in Brand Maggi. It also said that the
newly launched Maggi Hot Heads range has accelerated its growth in the value-
added segment.
Maggi noodles now has a 57% share of the instant noodles market in India vs.
80.2% in March 2015, according to Nestle India. In November, when the
company relaunched Maggi, it had a 10.9% share of the market.
Economic and Political News
GST-rates-impasse-Centre-states-trust-deficit-widens
MFs invest Rs 8,000 cr in equities in September
Highway contracts hit a rough patch in first half of FY17
Core sector rises 5% in September
Corporate News
Escorts: ordeal with non-tractor businesses continues
SBI to allot shares to govt on preferential basis for capital infusion of Rs5,681
crore
Bajaj Auto Q2 profit rises 7% to `1,122cr on other income boost
Market Outlook
November 01, 2016
Top Picks
Large Cap
Market Cap
CMP
Target
Upside
Company
Rationale
(` Cr)
(`)
(`)
(%)
To outpace battery industry growth due to better technological
Amara Raja Batteries
17,323
1,014
1,218
20.1
products leading to market share gains in both the
automotive OEM and replacement segments.
Healthy pace of branch expansion, backed by distribution
Axis Bank
1,16,140
487
630
29.5
network, will be the driving force for the bank’s retail business
and overall earnings.
Uptick in defense capex by government when coupled with
Bharat Electronics
31,229
1,301
1,414
8.7
BELs strong market positioning, indicate that good times are
ahead for BEL.
The stock is trading at attractive valuations and is factoring all
HCL Tech
1,07,817
764
1,000
30.8
the bad news.
Back on the growth trend, expect a long term growth of 14%
Infosys
2,29,109
997
1,249
25.2
to be a US$20bn in FY2020.
Source: Company, Angel Research
Mid Cap
Market Cap
CMP
Target
Upside
Company
Rationale
(` Cr)
(`)
(`)
(%)
We expect the company would report strong profitability
Asian Granito
819
272
351
29.0
owing to better product mix, higher B2C sales and
amalgamation synergy.
Among the top 4 players in the consumer durables segment.
Bajaj Electricals
2,624
260
306
17.9
Improved profitability backed by turn around in E&P segment.
Strong order book lends earnings visibility.
Favourable outlook for the AC industry to augur well for
Cooling products business which is out pacing the market
Blue Star
5,275
553
634
14.6
growth. EMPPAC division's profitability to improve once
operating environment turns around.
With a focus on the low and medium income (LMI) consumer
Dewan Housing Finance
10,270
328
350
6.7
segment, the company has increased its presence in tier-II &
III cities where the growth opportunity is immense.
Strong loan growth backed by diversified loan portfolio and
Equitas Holdings
5,990
179
235
31.6
adequate CAR. ROE & ROA likely to remain decent as risk of
dilution remains low. Attractive valuations considering growth.
Economic recovery to have favourable impact on advertising
& circulation revenue growth. Further, the acquisition of a
Jagran Prakashan
6,362
195
225
15.6
radio business (Radio City) would also boost the company's
revenue growth.
Speedier execution and speedier sales, strong revenue visibilty
Mahindra Lifespace
1,747
426
522
22.6
in short-to-long run, attractive valuations
We expect the company to report strong growth on back of
healthy growth in domestic branded sales (owing to
Mirza International
1,121
93
113
21.3
aggressive ad spend and addition in the number of EBOs &
multi-brand outlets [MBOs]) and healthy export revenues.
Massive capacity expansion along with rail advantage at ICD
Navkar Corporation
2,843
199
265
32.9
as well CFS augurs well for the company.
Strong brands and distribution network would boost growth
Siyaram Silk Mills
1,509
1,609
1,714
6.5
going ahead. Stock currently trades at an inexpensive
valuation.
Market leadership in Hindi news genre and no. 2 viewership
ranking in English news genre, exit from the radio business,
TV Today Network
1,982
332
363
9.3
and anticipated growth in ad spends by corporates to benefit
the stock.
Source: Company, Angel Research
Market Outlook
November 01, 2016
Key Upcoming Events
Result Calendar
Date
Company
Nov 1, 2016
Hindustan Media Ventures
Nov 2, 2016
HT Media
Nov 3, 2016
Ambuja Cements, Mphasis, MM Forging
Nov 4, 2016
Union Bank, Allahabad Bank, Central Bank, Competent Automobiles, Transport Corporation of India, Radico Khaitan
Amara Raja Batteries, Automotive Axle, Mangalam Cement, Punjab Natl.Bank, Dena Bank, Bank of Maharashtra,
Nov 5, 2016
Relaxo, Sterling Tools
Nov 7, 2016
CEAT, ICICI Bank, Godrej Consumer, GlaxoSmith Con, Britannia, Cravatex, Aventis
Nov 8, 2016
Bharat Forge, Ashok Leyland, BHEL, Vesuvius India, UFO Moviez
Nov 9, 2016
Apollo Tyres, Ramco Cements, Rural Elec.Corp., BPCL, ITD Cementation, Lupin
Motherson Sumi, Thermax, Blue Star, Page Industries, Bajaj Electrical, Finolex Cables, Elecon Engineering, Sun
Nov 10, 2016
Pharma, Team Lease Serv.
Source: Bloomberg, Angel Research
Global economic events release calendar
Date
Time
Country
Event Description
Unit
Period
Bloomberg Data
Last Reported Estimated
Nov 1, 2016
3:30PM Euro Zone
Euro-Zone GDP s.a. (QoQ)
% Change
3Q A
0.30
0.30
6:30AM China
PMI Manufacturing
Value
Oct
50.40
50.30
Nov 2, 2016 11:30PM US
FOMC rate decision
%
Nov 2
0.50
0.50
2:25PM Germany
PMI Manufacturing
Value
Oct F
55.10
55.10
2:25PM Germany
Unemployment change (000's)
Thousands
Oct
1.00
(1.00)
Nov 3, 2016
6:00PM US
Initial Jobless claims
Thousands
Oct 29
258.00
--
5:30PM UK
BOE Announces rates
% Ratio
Nov 3
0.25
0.25
Nov 4, 2016
2:25PM Germany
PMI Services
Value
Oct F
54.10
54.10
6:00PM US
Change in Nonfarm payrolls
Thousands
Oct
156.00
173.00
6:00PM US
Unnemployment rate
%
Oct
5.00
4.90
Nov 8, 2016
China
Exports YoY%
% Change
Oct
(10.00)
(6.00)
3:00PM UK
Industrial Production (YoY)
% Change
Sep
0.70
--
Nov 9, 2016
7:00AM China
Consumer Price Index (YoY)
% Change
Oct
1.90
2.00
Nov 10, 2016
India
Imports YoY%
% Change
Oct
(2.50)
--
5:30PM India
Industrial Production YoY
% Change
Sep
(0.70)
--
Nov 11, 2016
India
Exports YoY%
% Change
Oct
4.60
--
Nov 14, 2016 7:30AM China
Industrial Production (YoY)
% Change
Oct
6.10
--
12:00PM India
Monthly Wholesale Prices YoY%
% Change
Oct
3.57
--
Nov 15, 2016 3:00PM UK
CPI (YoY)
% Change
Oct
1.00
--
12:30PM Germany
GDP nsa (YoY)
% Change
3Q P
3.10
--
Nov 16, 2016 3:00PM UK
Jobless claims change
% Change
Oct
0.70
--
7:45PM US
Industrial Production
%
Oct
0.06
--
US
Producer Price Index (mom)
% Change
Oct
0.80
--
Source: Bloomberg, Angel Research
Market Outlook
November 01, 2016
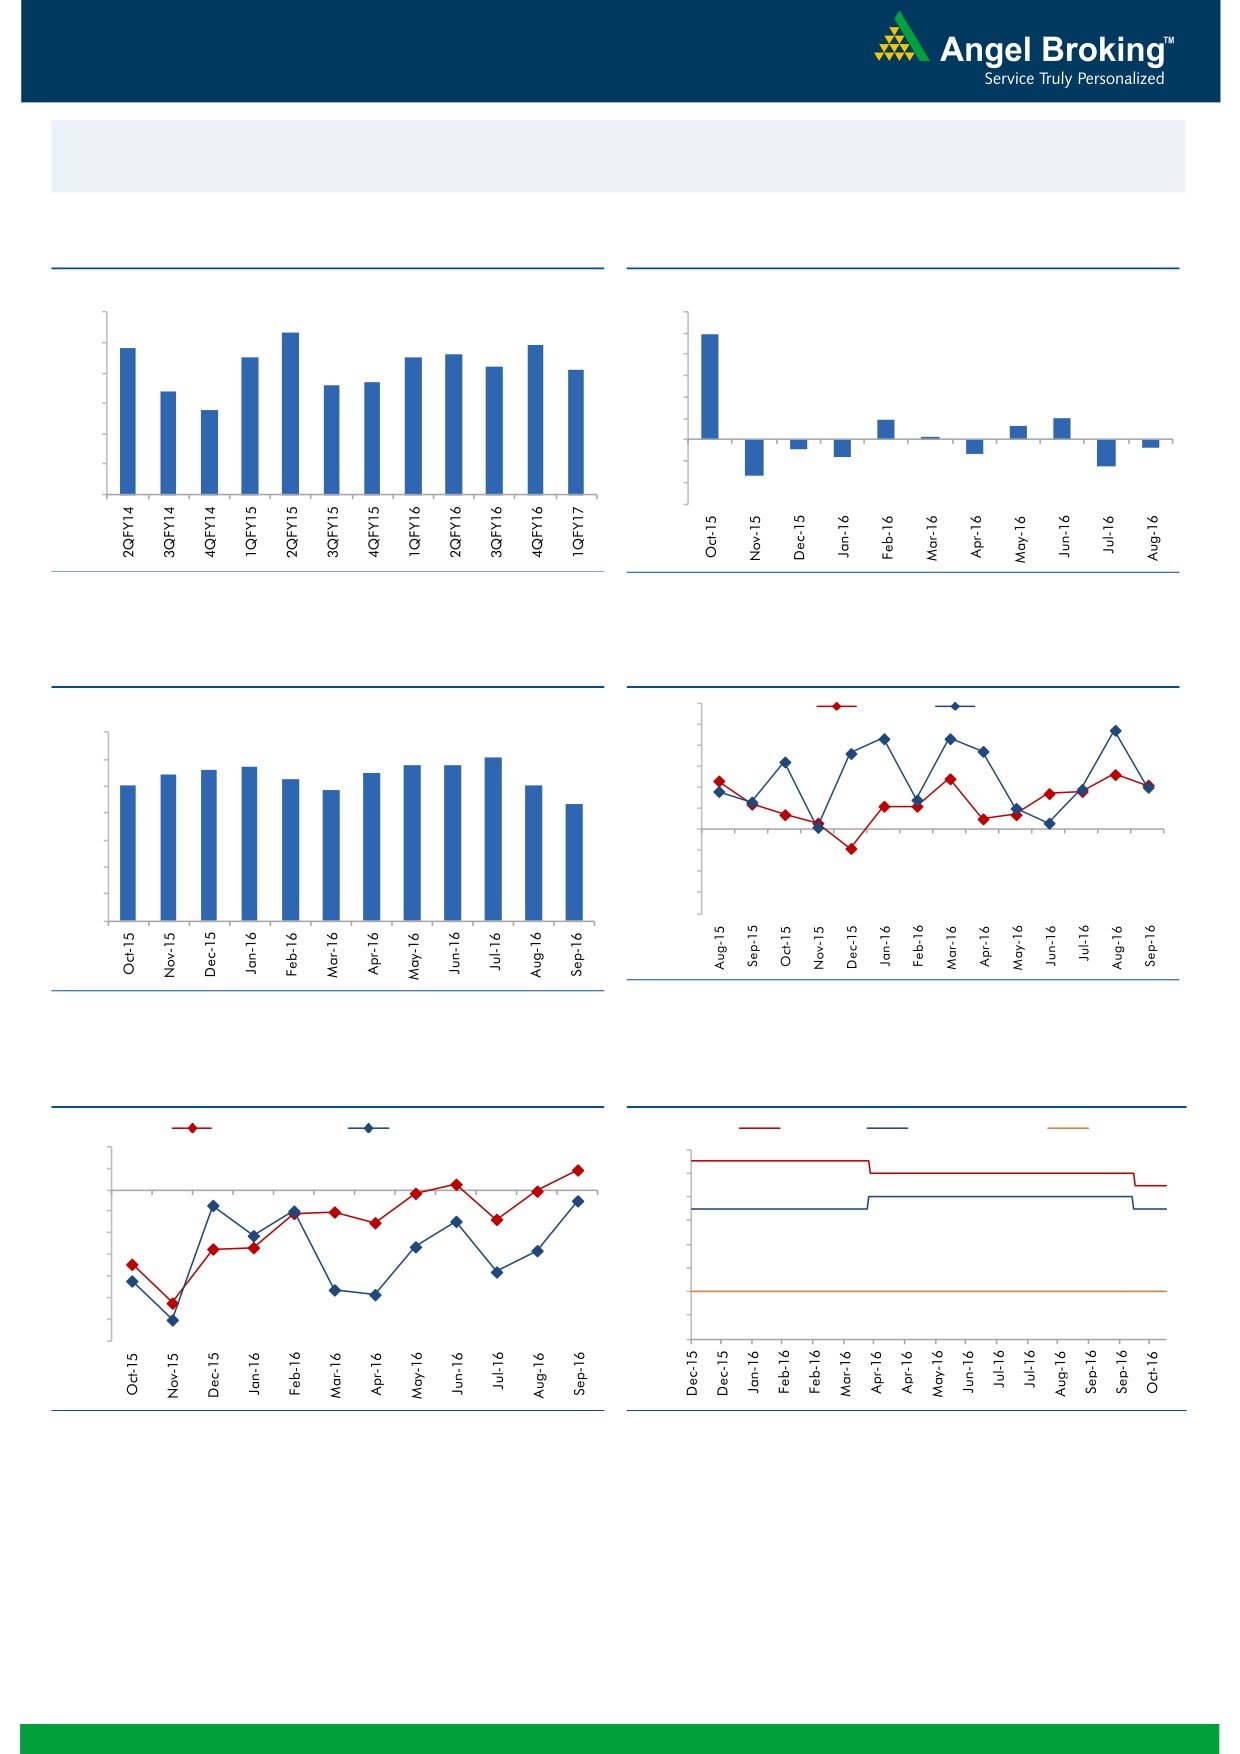
Macro watch
Exhibit 1: Quarterly GDP trends
Exhibit 2: IIP trends
(%)
(%)
9.0
12.0
8.3
9.9
7.8
7.9
10.0
8.0
7.5
7.5
7.6
7.2
7.1
8.0
6.6
6.7
7.0
6.4
6.0
5.8
6.0
4.0
1.9
2.0
1.3
2.0
0.3
5.0
-
4.0
(2.0)
(0.7)
(0.9)
(1.3)
(1.6)
(4.0)
(2.5)
3.0
(3.4)
(6.0)
Source: CSO, Angel Research
Source: MOSPI, Angel Research
Exhibit 3: Monthly CPI inflation trends
Exhibit 4: Manufacturing and services PMI
56.0
Mfg. PMI
Services PMI
(%)
55.0
7.0
6.1
54.0
5.6
5.7
5.8
5.8
6.0
5.4
5.5
5.0
5.3
5.1
53.0
4.8
5.0
4.3
52.0
4.0
51.0
50.0
3.0
49.0
2.0
48.0
1.0
47.0
46.0
-
Source: Market, Angel Research; Note: Level above 50 indicates expansion
Source: MOSPI, Angel Research
Exhibit 5: Exports and imports growth trends
Exhibit 6: Key policy rates
(%)
Exports yoy growth
Imports yoy growth
(%)
Repo rate
Reverse Repo rate
CRR
10.0
7.00
5.0
6.50
0.0
6.00
(5.0)
5.50
(10.0)
5.00
(15.0)
4.50
(20.0)
4.00
(25.0)
(30.0)
3.50
(35.0)
3.00
Source: Bloomberg, Angel Research
Source: RBI, Angel Research
Market Outlook
November 01, 2016
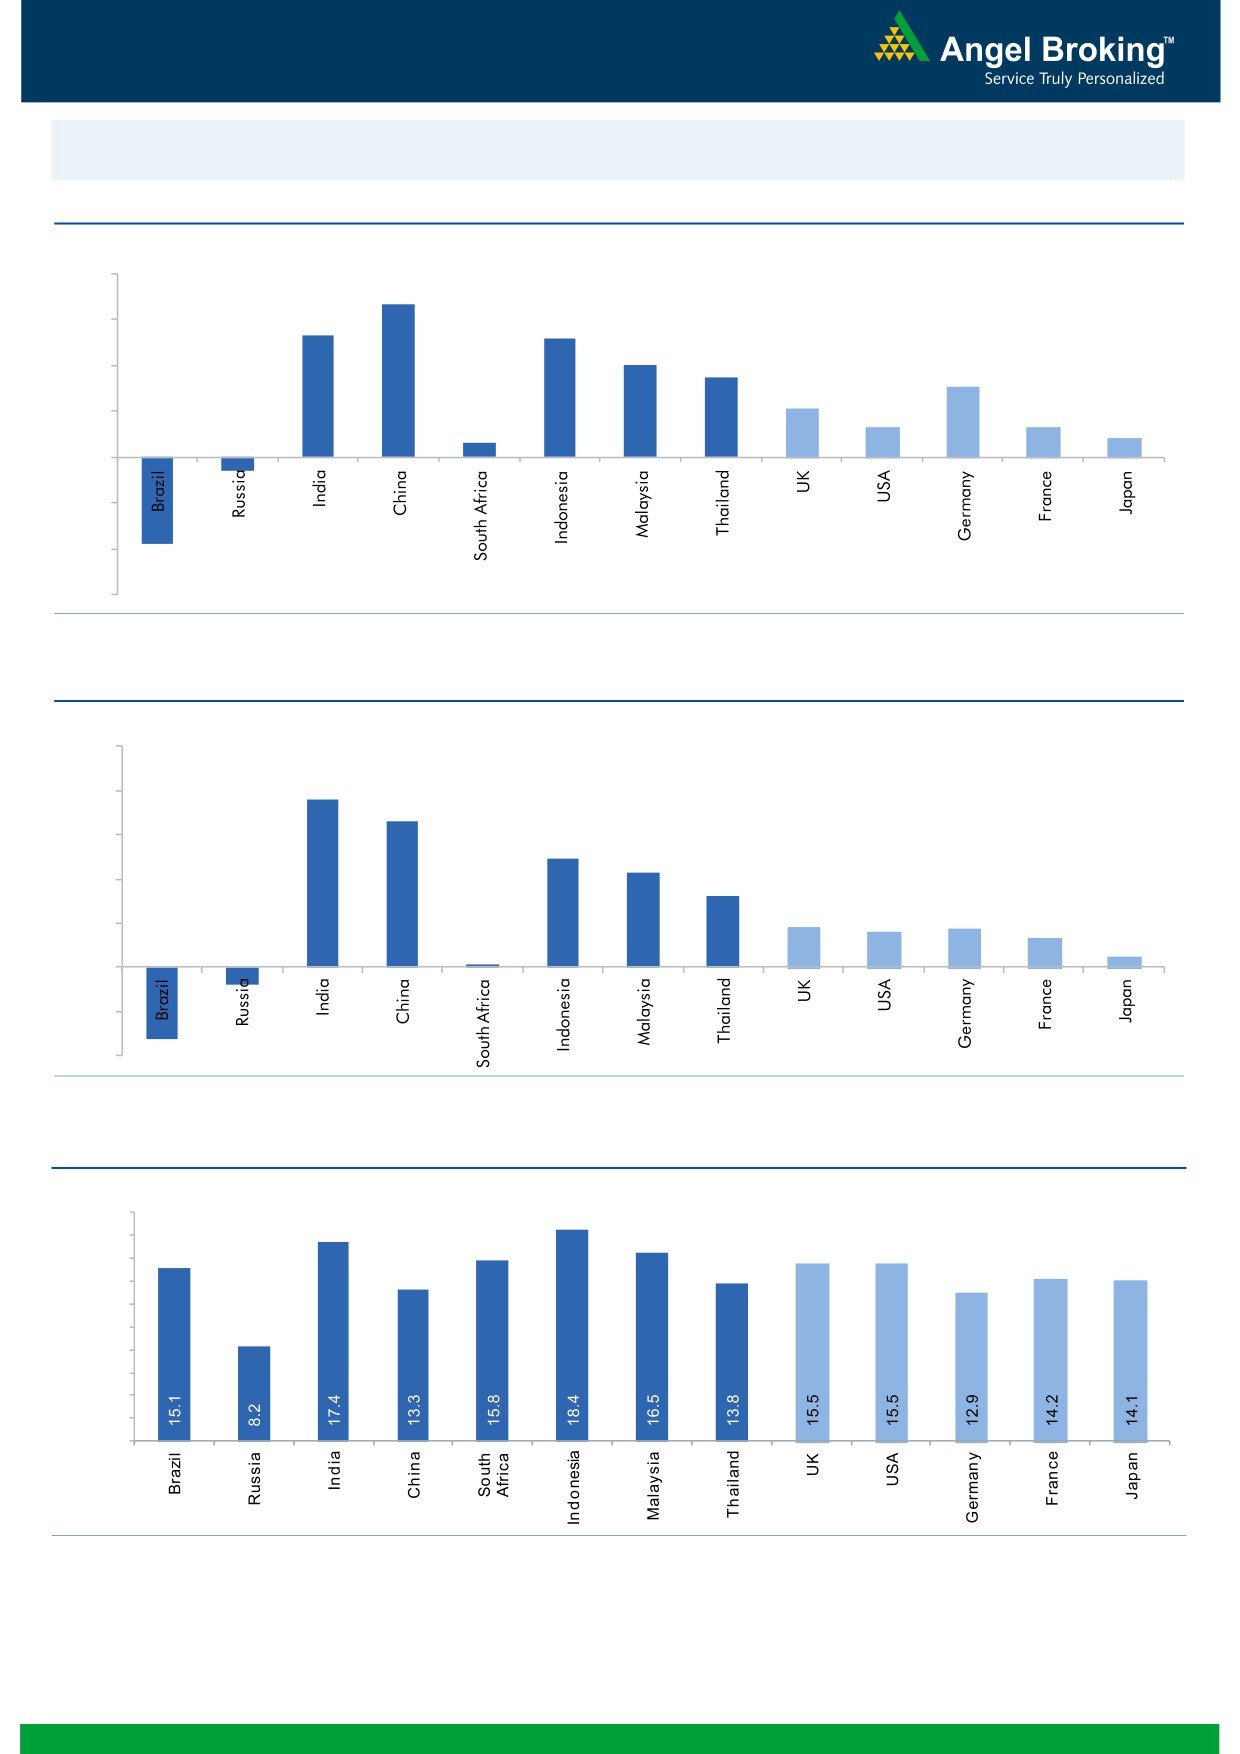
Global watch
Exhibit 1: Latest quarterly GDP Growth (%, yoy) across select developing and developed countries
(%)
8.0
6.7
6.0
5.3
0.6
5.2
4.0
3.5
4.0
3.1
2.1
2.0
1.3
1.3
0.8
-
(2.0)
(0.6)
(4.0)
(3.8)
(6.0)
Source: Bloomberg, Angel Research
Exhibit 2: 2016 GDP Growth projection by IMF (%, yoy) across select developing and developed countries
(%)
10.0
7.6
8.0
6.6
6.0
4.9
4.3
4.0
3.2
1.8
1.7
1.6
2.0
1.3
(0.8)
0.5
(3.3)
0.1
-
(2.0)
(4.0)
Source: IMF, Angel Research
Exhibit 3: One year forward P-E ratio across select developing and developed countries
(x)
20.0
18.0
16.0
14.0
12.0
10.0
8.0
6.0
4.0
2.0
-
Source: IMF, Angel Research
Market Outlook
November 01, 2016
Exhibit 4: Relative performance of indices across globe
Returns (%)
Country
Name of index
Closing price
1M
3M
1YR
Brazil
Bovespa
64,925
9.4
13.3
37.5
Russia
Micex
1,990
(0.3)
4.0
16.4
India
Nifty
8,626
(0.9)
0.4
4.5
China
Shanghai Composite
3,100
2.3
2.9
(7.9)
South Africa
Top 40
44,019
(4.5)
(4.1)
(8.2)
Mexico
Mexbol
48,009
0.7
2.6
5.9
Indonesia
LQ45
927
0.8
0.3
17.7
Malaysia
KLCI
1,672
0.5
0.5
(1.9)
Thailand
SET 50
937
(0.5)
(2.9)
2.2
USA
Dow Jones
18,142
(0.0)
(1.4)
1.8
UK
FTSE
6,954
0.5
3.9
8.9
Japan
Nikkei
17,425
5.8
4.6
(6.1)
Germany
DAX
10,665
2.2
3.2
(2.6)
France
CAC
4,509
1.5
4.2
(8.2)
Source: Bloomberg, Angel Research
Stock Watch
November 01, 2016
Company Name
Reco
CMP
Target
Mkt Cap
Sales ( Čcr )
OPM(%)
EPS (Č)
PER(x)
P/BV(x)
RoE(%)
EV/Sales(x)
(Č)
Price ( Č)
( Č cr )
FY17E FY18E
FY17E
FY18E
FY17E
FY18E
FY17E
FY18E
FY17E
FY18E
FY17E
FY18E
FY17E
FY18E
Agri / Agri Chemical
Rallis
Neutral
220
-
4,284
1,937
2,164
13.3
14.3
9.0
11.0
24.5
20.0
4.3
3.7
18.4
19.8
2.3
2.0
United Phosphorus
Neutral
698
-
35,375
15,176
17,604
18.5
18.5
37.4
44.6
18.7
15.7
3.7
3.0
21.4
21.2
2.4
2.1
Auto & Auto Ancillary
Ashok Leyland
Buy
90
111
25,684
22,407
26,022
10.6
10.6
5.2
6.4
17.3
14.1
3.9
3.3
23.6
24.7
1.2
1.0
Bajaj Auto
Neutral
2,835
-
82,025
25,093
27,891
19.5
19.2
143.9
162.5
19.7
17.5
5.5
4.8
30.3
29.4
3.0
2.6
Bharat Forge
Neutral
885
-
20,594
7,726
8,713
20.5
21.2
35.3
42.7
25.1
20.7
4.6
4.2
18.9
20.1
2.7
2.4
Eicher Motors
Neutral
24,020
-
65,241
16,583
20,447
17.5
18.0
598.0
745.2
40.2
32.2
13.7
10.5
41.2
38.3
3.8
3.0
Gabriel India
Neutral
127
-
1,823
1,544
1,715
9.0
9.3
5.4
6.3
23.5
20.1
4.4
3.9
18.9
19.5
1.1
1.0
Hero Motocorp
Accumulate
3,348
3,541
66,848
30,958
34,139
15.7
15.7
193.6
208.3
17.3
16.1
6.8
5.6
34.2
30.5
2.0
1.8
Jamna Auto Industries Neutral
226
-
1,802
1,486
1,620
9.8
9.9
15.0
17.2
15.0
13.1
3.3
2.8
21.8
21.3
1.3
1.2
L G Balakrishnan & Bros Neutral
687
-
1,078
1,302
1,432
11.6
11.9
43.7
53.0
15.7
13.0
2.2
2.0
13.8
14.2
0.9
0.8
Mahindra and Mahindra Neutral
1,311
-
81,410
46,534
53,077
11.6
11.7
67.3
78.1
19.5
16.8
3.2
2.8
15.4
15.8
1.7
1.5
Maruti
Neutral
5,875
-
177,481
69,186
82,217
14.7
14.4
198.5
241.4
29.6
24.3
5.8
4.7
20.2
20.0
2.3
1.8
Minda Industries
Neutral
366
-
2,899
2,728
3,042
9.0
9.1
68.2
86.2
5.4
4.2
1.2
1.0
23.8
24.3
1.1
1.0
Motherson Sumi
Neutral
331
-
46,466
45,896
53,687
7.8
8.3
13.0
16.1
25.4
20.6
8.2
6.5
34.7
35.4
1.1
0.9
Rane Brake Lining
Neutral
1,162
-
919
511
562
11.3
11.5
28.1
30.9
41.3
37.6
6.3
5.7
15.3
15.0
1.9
1.8
Setco Automotive
Neutral
42
-
558
741
837
13.0
13.0
15.2
17.0
2.8
2.5
0.5
0.4
15.8
16.3
1.1
1.0
Tata Motors
Neutral
536
-
154,711
300,209
338,549
8.9
8.4
42.7
54.3
12.6
9.9
2.0
1.7
15.6
17.2
0.6
0.5
TVS Motor
Neutral
405
-
19,224
13,390
15,948
6.9
7.1
12.8
16.5
31.7
24.5
7.9
6.3
26.3
27.2
1.5
1.2
Amara Raja Batteries
Buy
1,014
1,218
17,323
5,429
6,471
17.5
17.6
35.3
43.5
28.7
23.3
6.6
5.3
25.3
24.8
3.1
2.5
Exide Industries
Neutral
196
-
16,626
7,439
8,307
15.0
15.0
8.1
9.3
24.2
21.0
3.4
3.0
14.3
16.7
1.9
1.7
Apollo Tyres
Buy
202
235
10,280
12,877
14,504
14.3
13.9
21.4
23.0
9.4
8.8
1.5
1.3
16.4
15.2
1.0
0.9
Ceat
Buy
1,214
1,450
4,910
7,524
8,624
13.0
12.7
131.1
144.3
9.3
8.4
1.7
1.4
19.8
18.6
0.7
0.6
JK Tyres
Neutral
141
-
3,192
7,455
8,056
15.0
15.0
21.8
24.5
6.5
5.7
1.4
1.1
22.8
21.3
0.6
0.5
Swaraj Engines
Neutral
1,340
-
1,664
660
810
15.2
16.4
54.5
72.8
24.6
18.4
7.7
7.0
31.5
39.2
2.3
1.9
Subros
Neutral
166
-
996
1,488
1,681
11.7
11.9
6.4
7.2
25.9
23.2
2.7
2.5
10.8
11.4
0.9
0.8
Indag Rubber
Neutral
192
-
504
286
326
19.8
16.8
11.7
13.3
16.4
14.4
2.8
2.6
17.8
17.1
1.4
1.2
Capital Goods
ACE
Neutral
46
-
452
709
814
4.1
4.6
1.4
2.1
32.6
21.8
1.3
1.3
4.4
6.0
0.8
0.7
BEML
Neutral
941
-
3,918
3,451
4,055
6.3
9.2
31.4
57.9
30.0
16.3
1.8
1.6
6.3
10.9
1.3
1.1
Bharat Electronics
Accumulate
1,301
1,414
31,229
8,137
9,169
16.8
17.2
58.7
62.5
22.2
20.8
3.4
3.1
44.6
46.3
2.8
2.5
Stock Watch
November 01, 2016
Company Name
Reco
CMP
Target
Mkt Cap
Sales ( Čcr )
OPM(%)
EPS (Č)
PER(x)
P/BV(x)
RoE(%)
EV/Sales(x)
(Č)
Price ( Č)
( Č cr )
FY17E
FY18E
FY17E
FY18E
FY17E
FY18E
FY17E
FY18E
FY17E
FY18E
FY17E
FY18E
FY17E
FY18E
Capital Goods
Voltas
Accumulate
387
407
12,820
6,511
7,514
7.9
8.7
12.9
16.3
30.0
23.8
5.4
4.7
16.7
18.5
1.7
1.5
BGR Energy
Neutral
117
-
841
16,567
33,848
6.0
5.6
7.8
5.9
14.9
19.8
0.9
0.8
4.7
4.2
0.2
0.1
BHEL
Neutral
139
-
33,985
28,797
34,742
-
2.8
2.3
6.9
60.4
20.1
1.0
1.0
1.3
4.8
0.8
0.6
Blue Star
Accumulate
553
634
5,275
4,283
5,077
5.9
7.3
14.9
22.1
37.2
25.0
7.2
6.1
20.4
26.4
1.3
1.1
Crompton Greaves
Neutral
76
-
4,779
5,777
6,120
5.9
7.0
3.3
4.5
23.1
16.9
1.0
1.0
4.4
5.9
0.8
0.7
Greaves Cotton
Neutral
139
-
3,383
1,755
1,881
16.8
16.9
7.8
8.5
17.8
16.3
3.6
3.3
20.6
20.9
1.6
1.5
Inox Wind
Neutral
212
-
4,712
5,605
6,267
15.7
16.4
24.8
30.0
8.6
7.1
2.4
1.8
25.9
24.4
0.9
0.7
KEC International
Neutral
124
-
3,181
9,294
10,186
7.9
8.1
9.9
11.9
12.5
10.4
1.8
1.6
15.6
16.3
0.6
0.5
Thermax
Neutral
849
-
10,121
5,421
5,940
7.3
7.3
25.7
30.2
33.1
28.1
4.0
3.7
12.2
13.1
1.8
1.6
VATech Wabag
Buy
495
681
2,700
3,136
3,845
8.9
9.1
26.0
35.9
19.1
13.8
2.4
2.0
13.4
15.9
0.8
0.6
Cement
ACC
Neutral
1,519
-
28,529
11,225
13,172
13.2
16.9
44.5
75.5
34.1
20.1
3.2
3.0
11.2
14.2
2.5
2.2
Ambuja Cements
Neutral
242
-
48,033
9,350
10,979
18.2
22.5
5.8
9.5
41.7
25.5
3.5
3.1
10.2
12.5
5.1
4.4
India Cements
Neutral
157
-
4,824
4,364
4,997
18.5
19.2
7.9
11.3
19.9
13.9
1.4
1.4
8.0
8.5
1.9
1.6
JK Cement
Neutral
947
-
6,620
4,398
5,173
15.5
17.5
31.2
55.5
30.3
17.1
3.6
3.2
12.0
15.5
2.1
1.7
J K Lakshmi Cement
Buy
489
565
5,758
2,913
3,412
14.5
19.5
7.5
22.5
65.3
21.8
4.0
3.4
12.5
18.0
2.6
2.1
Orient Cement
Buy
175
215
3,586
2,114
2,558
18.5
20.5
8.1
11.3
21.6
15.5
3.2
2.7
9.0
14.0
2.3
1.8
UltraTech Cement
Neutral
3,972
-
109,014
25,768
30,385
21.0
23.5
111.0
160.0
35.8
24.8
4.6
4.0
13.5
15.8
4.3
3.6
Construction
ITNL
Neutral
111
-
3,666
8,946
10,017
31.0
31.6
8.1
9.1
13.8
12.3
0.5
0.5
4.2
5.0
3.7
3.5
KNR Constructions
Neutral
765
-
2,152
1,385
1,673
14.7
14.0
41.2
48.5
18.6
15.8
3.5
3.0
14.9
15.2
1.6
1.3
Larsen & Toubro
Buy
1,478
1,700
137,741
67,665
77,249
10.7
11.5
57.3
71.2
25.8
20.8
2.4
2.2
12.6
14.3
2.2
1.9
Gujarat Pipavav Port
Neutral
163
-
7,858
705
788
52.2
51.7
5.0
5.6
32.5
29.0
3.2
2.9
11.2
11.2
10.8
9.2
Nagarjuna Const.
Neutral
93
-
5,184
8,842
9,775
9.1
8.8
5.3
6.4
17.6
14.6
1.4
1.3
8.2
9.1
0.7
0.6
PNC Infratech
Buy
121
143
3,103
2,350
2,904
13.1
13.2
9.0
8.8
13.4
13.7
0.5
0.4
15.9
13.9
1.4
1.2
Simplex Infra
Neutral
326
-
1,610
6,829
7,954
10.5
10.5
31.4
37.4
10.4
8.7
1.1
1.0
9.9
13.4
0.7
0.6
Power Mech Projects
Neutral
509
-
749
1,801
2,219
12.7
14.6
72.1
113.9
7.1
4.5
1.3
1.1
16.8
11.9
0.4
0.3
Sadbhav Engineering
Accumulate
279
298
4,783
3,598
4,140
10.3
10.6
9.0
11.9
31.0
23.4
3.2
2.9
9.9
11.9
1.6
1.4
NBCC
Neutral
240
-
14,394
7,428
9,549
7.9
8.6
8.2
11.0
29.3
21.8
1.5
1.2
28.2
28.7
1.7
1.2
MEP Infra
Neutral
42
-
680
1,877
1,943
30.6
29.8
3.0
4.2
13.9
10.0
6.7
4.5
0.6
0.6
1.7
1.6
SIPL
Neutral
103
-
3,612
1,036
1,252
65.5
66.2
(8.4)
(5.6)
3.8
4.4
(22.8)
(15.9)
11.7
9.7
Stock Watch
November 01, 2016
Company Name
Reco
CMP
Target
Mkt Cap
Sales ( Čcr )
OPM(%)
EPS (Č)
PER(x)
P/BV(x)
RoE(%)
EV/Sales(x)
(Č)
Price ( Č)
( Č cr )
FY17E
FY18E
FY17E
FY18E
FY17E
FY18E
FY17E
FY18E
FY17E
FY18E
FY17E
FY18E
FY17E
FY18E
Construction
Engineers India
Neutral
269
-
9,075
1,725
1,935
16.0
19.1
11.4
13.9
23.6
19.4
3.3
3.2
13.4
15.3
4.2
3.8
Financials
Axis Bank
Buy
487
630
116,140
46,932
53,575
3.5
3.4
32.4
44.6
15.0
10.9
1.9
1.7
13.6
16.5
-
-
Bank of Baroda
Neutral
156
-
35,910
19,980
23,178
1.8
1.8
11.5
17.3
13.6
9.0
1.6
1.3
8.3
10.1
-
-
Canara Bank
Neutral
314
-
17,034
15,225
16,836
1.8
1.8
14.5
28.0
21.6
11.2
1.5
1.2
5.8
8.5
-
-
Dewan Housing Finance Accumulate
328
350
10,270
2,225
2,688
2.9
2.9
29.7
34.6
11.1
9.5
1.8
1.5
16.1
16.8
-
-
Equitas Holdings
Buy
179
235
5,990
939
1,281
11.7
11.5
5.8
8.2
30.8
21.8
2.7
2.4
10.9
11.5
-
-
Federal Bank
Neutral
82
-
14,106
9,353
10,623
2.9
2.9
4.4
5.8
18.7
14.2
1.8
1.6
9.5
11.0
-
-
HDFC
Neutral
1,388
-
219,454
11,475
13,450
3.4
3.4
45.3
52.5
30.6
26.4
5.9
5.2
20.2
20.5
-
-
HDFC Bank
Accumulate
1,259
1,350
318,847
46,097
55,433
4.5
4.5
58.4
68.0
21.6
18.5
3.8
3.2
18.8
18.6
-
-
ICICI Bank
Neutral
277
-
161,249
39,029
45,903
3.3
3.3
16.7
16.3
16.6
17.0
2.1
1.9
10.1
12.4
-
-
LIC Housing Finance
Accumulate
583
630
29,399
3,712
4,293
2.6
2.5
39.0
46.0
14.9
12.7
2.8
2.4
19.9
20.1
-
-
Punjab Natl.Bank
Neutral
144
-
30,621
23,532
23,595
2.3
2.4
6.8
12.6
21.2
11.4
3.3
2.3
3.3
6.5
-
-
RBL Bank
Neutral
375
-
13,855
1,783
2,309
2.6
2.6
12.7
16.4
29.5
22.8
3.2
2.9
12.8
13.3
-
-
South Ind.Bank
Neutral
24
-
3,207
6,435
7,578
2.5
2.5
2.7
3.1
8.8
7.7
1.1
1.0
10.1
11.2
-
-
St Bk of India
Neutral
258
-
200,163
88,650
98,335
2.6
2.6
13.5
18.8
19.1
13.7
1.8
1.6
7.0
8.5
-
-
Union Bank
Neutral
148
-
10,147
13,450
14,925
2.3
2.3
25.5
34.5
5.8
4.3
0.8
0.7
7.5
10.2
-
-
Yes Bank
Neutral
1,272
-
53,547
8,978
11,281
3.3
3.4
74.0
90.0
17.2
14.1
3.3
2.8
17.0
17.2
-
-
FMCG
Asian Paints
Neutral
1,070
-
102,634
17,128
18,978
16.8
16.4
19.1
20.7
56.0
51.7
19.5
18.4
34.8
35.5
5.9
5.3
Britannia
Accumulate
3,306
3,626
39,668
9,795
11,040
14.6
14.9
80.3
94.0
41.2
35.2
16.9
13.1
41.2
-
3.9
3.4
Colgate
Neutral
973
-
26,463
4,605
5,149
23.4
23.4
23.8
26.9
40.9
36.2
22.6
17.7
64.8
66.8
5.7
5.1
Dabur India
Neutral
291
-
51,173
8,315
9,405
19.8
20.7
8.1
9.2
35.9
31.6
10.0
8.3
31.6
31.0
5.8
5.1
GlaxoSmith Con*
Neutral
6,051
-
25,449
4,350
4,823
21.2
21.4
179.2
196.5
33.8
30.8
9.0
7.6
27.1
26.8
5.2
4.6
Godrej Consumer
Neutral
1,606
-
54,691
10,235
11,428
18.4
18.6
41.1
44.2
39.1
36.3
8.7
7.3
24.9
24.8
5.4
4.8
HUL
Neutral
838
-
181,407
35,252
38,495
17.6
17.4
20.4
21.9
41.0
38.3
33.7
29.6
82.2
77.3
5.0
4.5
ITC
Buy
243
283
292,778
40,059
44,439
39.0
39.2
9.1
10.1
26.7
24.0
7.3
6.4
27.2
26.5
6.8
6.1
Marico
Accumulate
282
300
36,396
6,430
7,349
18.8
19.5
6.4
7.7
44.1
36.6
13.3
11.2
33.2
32.5
5.5
4.7
Nestle*
Neutral
6,961
-
67,110
10,073
11,807
20.7
21.5
124.8
154.2
55.8
45.1
22.9
20.6
34.8
36.7
6.5
5.5
Tata Global
Neutral
140
-
8,833
8,675
9,088
9.8
9.8
7.4
8.2
18.9
17.1
2.1
2.1
7.9
8.1
0.9
0.9
Procter & Gamble
Neutral
7,028
-
22,812
2,939
3,342
23.2
23.0
146.2
163.7
48.1
42.9
107.6
103.2
25.3
23.5
7.3
6.4
Hygiene
Stock Watch
November 01, 2016
Company Name
Reco
CMP
Target
Mkt Cap
Sales ( Čcr )
OPM(%)
EPS (Č)
PER(x)
P/BV(x)
RoE(%)
EV/Sales(x)
(Č)
Price ( Č)
( Č cr )
FY17E FY18E
FY17E
FY18E
FY17E
FY18E
FY17E
FY18E
FY17E
FY18E
FY17E
FY18E
FY17E
FY18E
IT
HCL Tech^
Buy
764
1,000
107,817
49,242
57,168
20.5
20.5
55.7
64.1
13.7
11.9
2.8
2.1
20.3
17.9
2.1
1.7
Infosys
Buy
997
1,249
229,109
68,350
77,326
27.0
27.0
62.5
69.4
16.0
14.4
3.4
3.1
21.3
21.6
2.8
2.4
TCS
Accumulate
2,399
2,620
472,755
119,025
133,308
27.6
27.6
131.2
145.5
18.3
16.5
5.9
5.5
32.4
33.1
3.8
3.3
Tech Mahindra
Buy
436
700
42,283
30,347
33,685
17.0
17.0
37.5
41.3
11.6
10.6
2.5
2.2
21.8
20.7
1.1
1.0
Wipro
Buy
462
590
112,227
55,440
60,430
18.1
18.1
35.9
39.9
12.9
11.6
2.3
2.1
19.0
19.3
1.7
1.6
Media
D B Corp
Neutral
382
-
7,015
2,297
2,590
27.4
28.2
21.0
23.4
18.2
16.3
4.2
3.7
23.7
23.1
2.9
2.5
HT Media
Neutral
90
-
2,104
2,693
2,991
12.6
12.9
7.9
9.0
11.4
10.0
1.0
0.9
7.8
8.3
0.4
0.2
Jagran Prakashan
Buy
195
225
6,362
2,355
2,635
28.0
28.0
10.8
12.5
18.0
15.6
3.9
3.4
21.7
21.7
2.7
2.4
Sun TV Network
Neutral
546
-
21,505
2,850
3,265
70.1
71.0
26.2
30.4
20.8
18.0
5.3
4.7
24.3
25.6
7.1
6.1
Hindustan Media
Neutral
302
-
2,216
1,016
1,138
24.3
25.2
27.3
30.1
11.1
10.0
2.1
1.9
16.2
15.8
1.5
1.3
Ventures
TV Today Network
Accumulate
332
363
1,982
637
743
27.5
27.5
18.4
21.4
18.1
15.5
3.2
2.7
17.4
17.2
2.7
2.2
Metals & Mining
Coal India
Neutral
324
-
204,903
84,638
94,297
21.4
22.3
24.5
27.1
13.2
12.0
5.5
5.3
42.6
46.0
1.9
1.7
Hind. Zinc
Neutral
253
-
106,964
14,252
18,465
55.9
48.3
15.8
21.5
16.0
11.8
2.6
2.3
17.0
20.7
7.5
5.8
Hindalco
Neutral
150
-
30,892
107,899
112,095
7.4
8.2
9.2
13.0
16.3
11.5
0.8
0.7
4.8
6.6
0.8
0.7
JSW Steel
Neutral
1,658
-
40,079
53,201
58,779
16.1
16.2
130.6
153.7
12.7
10.8
1.7
1.5
14.0
14.4
1.5
1.3
NMDC
Neutral
131
-
52,017
6,643
7,284
44.4
47.7
7.1
7.7
18.5
17.0
1.6
1.6
8.8
9.2
5.6
5.1
SAIL
Neutral
52
-
21,497
47,528
53,738
(0.7)
2.1
(1.9)
2.6
20.0
0.6
0.5
(1.6)
3.9
1.3
1.2
Vedanta
Neutral
203
-
60,065
71,744
81,944
19.2
21.7
13.4
20.1
15.1
10.1
1.3
1.2
8.4
11.3
1.2
0.9
Tata Steel
Neutral
404
-
39,281
121,374
121,856
7.2
8.4
18.6
34.3
21.7
11.8
1.4
1.2
6.1
10.1
1.0
0.9
Oil & Gas
Cairn India
Neutral
226
-
42,409
9,127
10,632
4.3
20.6
8.8
11.7
25.7
19.3
0.8
0.8
3.3
4.2
6.1
5.1
GAIL
Neutral
433
-
54,938
56,220
65,198
9.3
10.1
27.1
33.3
16.0
13.0
1.5
1.4
9.3
10.7
1.2
1.0
ONGC
Neutral
288
-
246,313
137,222
152,563
15.0
21.8
19.5
24.1
14.8
12.0
1.3
1.2
8.5
10.1
2.1
1.9
Indian Oil Corp
Neutral
324
-
157,089
373,359
428,656
5.9
5.5
54.0
59.3
6.0
5.5
0.9
0.8
16.0
15.6
0.6
0.5
Reliance Industries
Neutral
1,054
-
341,592
301,963
358,039
12.1
12.6
87.7
101.7
12.0
10.4
1.2
1.1
10.7
11.3
1.6
1.3
Pharmaceuticals
Alembic Pharma
Neutral
673
-
12,693
3,483
4,083
20.2
21.4
24.3
30.4
27.7
22.2
6.3
5.0
25.5
25.3
3.6
3.0
Aurobindo Pharma
Accumulate
812
877
47,539
15,720
18,078
23.7
23.7
41.4
47.3
19.6
17.2
5.1
4.0
29.6
26.1
3.2
2.8
Sanofi India*
Neutral
4,342
-
10,000
2,357
2,692
17.3
17.3
153.5
169.2
28.3
25.7
4.8
3.9
25.8
28.4
3.9
3.2
Cadila Healthcare
Neutral
423
-
43,263
11,126
13,148
22.0
22.0
17.1
20.0
24.7
21.1
6.4
5.0
28.8
26.6
3.9
3.2
Cipla
Neutral
574
-
46,161
15,378
18,089
17.4
18.4
21.6
27.2
26.6
21.1
3.4
3.0
13.7
15.2
3.2
2.7
Stock Watch
November 01, 2016
Company Name
Reco
CMP
Target
Mkt Cap
Sales ( Čcr )
OPM(%)
EPS (Č)
PER(x)
P/BV(x)
RoE(%)
EV/Sales(x)
(Č)
Price ( Č)
( Č cr )
FY17E FY18E
FY17E
FY18E
FY17E
FY18E
FY17E
FY18E
FY17E
FY18E
FY17E
FY18E
FY17E
FY18E
Pharmaceuticals
Dr Reddy's
Neutral
3,360
-
55,678
16,043
18,119
23.1
24.7
126.0
157.8
26.7
21.3
3.9
3.4
15.7
17.1
3.4
3.0
Dishman Pharma
Neutral
242
-
3,904
1,718
1,890
22.7
22.8
9.5
11.3
25.5
21.4
2.5
2.2
10.1
10.9
2.7
2.4
GSK Pharma*
Neutral
2,910
-
24,648
3,528
3,811
16.6
18.8
51.8
59.4
56.2
49.0
15.0
15.0
26.3
30.6
6.8
6.3
Indoco Remedies
Neutral
285
-
2,626
1,112
1,289
18.2
18.2
13.2
15.6
21.6
18.3
3.8
3.3
19.2
19.2
2.5
2.1
Ipca labs
Neutral
610
-
7,696
3,303
3,799
15.3
15.3
17.3
19.7
35.3
31.0
3.1
2.8
9.1
9.4
2.5
2.1
Lupin
Buy
1,490
1,809
67,189
15,912
18,644
26.4
26.7
58.1
69.3
25.7
21.5
5.0
4.1
21.4
20.9
4.3
3.5
Sun Pharma
Buy
744
944
178,998
31,129
35,258
30.0
30.9
28.0
32.8
26.6
22.7
4.1
3.4
18.7
18.9
5.3
4.5
Power
Tata Power
Neutral
78
-
21,177
36,916
39,557
17.4
27.1
5.1
6.3
15.4
12.4
1.4
1.2
9.0
10.3
1.6
1.4
NTPC
Neutral
152
-
125,537
86,605
95,545
17.5
20.8
11.8
13.4
12.9
11.4
1.3
1.2
10.5
11.1
2.8
2.8
Power Grid
Neutral
176
-
92,076
25,763
29,762
74.3
73.1
14.8
17.3
11.9
10.2
1.9
1.6
16.9
17.5
7.8
7.5
Real Estate
MLIFE
Buy
426
522
1,747
1,152
1,300
22.7
24.6
29.9
35.8
14.2
11.9
1.1
1.0
7.6
8.6
2.2
1.9
Telecom
Bharti Airtel
Neutral
319
-
127,377
105,086
114,808
34.5
34.7
12.2
16.4
26.1
19.4
1.8
1.7
6.8
8.4
2.1
1.8
Idea Cellular
Neutral
76
-
27,438
40,133
43,731
37.2
37.1
6.4
6.5
11.9
11.7
1.0
0.9
8.2
7.6
1.7
1.4
zOthers
Abbott India
Neutral
4,958
-
10,536
3,153
3,583
14.1
14.4
152.2
182.7
32.6
27.1
159.9
136.6
25.6
26.1
3.1
2.6
Bajaj Electricals
Buy
260
306
2,624
5,099
5,805
5.6
5.9
11.4
14.6
22.8
17.8
3.1
2.7
13.4
15.1
0.5
0.5
Finolex Cables
Neutral
440
-
6,729
2,883
3,115
12.0
12.1
14.2
18.6
31.0
23.7
16.5
14.4
15.8
14.6
2.0
1.8
Goodyear India*
Neutral
758
-
1,748
1,598
1,704
10.4
10.2
49.4
52.6
15.3
14.4
70.8
62.1
18.2
17.0
0.8
109.1
Hitachi
Neutral
1,488
-
4,046
2,081
2,433
8.8
8.9
33.4
39.9
44.6
37.3
35.9
30.0
22.1
21.4
1.9
1.6
Jyothy Laboratories
Neutral
357
-
6,474
1,440
2,052
11.5
13.0
8.5
10.0
42.0
35.7
10.2
9.4
18.6
19.3
4.8
3.3
Page Industries
Neutral
16,397
-
18,289
2,450
3,124
20.1
17.6
299.0
310.0
54.8
52.9
365.2
278.8
47.1
87.5
7.5
5.9
Relaxo Footwears
Neutral
427
-
5,129
2,085
2,469
9.2
8.2
7.6
8.0
56.5
53.8
21.9
18.7
17.9
18.8
2.6
2.2
Siyaram Silk Mills
Accumulate
1,609
1,714
1,509
1,799
2,040
11.6
11.7
104.9
122.4
15.3
13.1
2.5
2.2
16.4
16.4
1.0
0.9
Styrolution ABS India*
Neutral
649
-
1,141
1,440
1,537
9.2
9.0
40.6
42.6
16.0
15.2
40.8
37.1
12.3
11.6
0.8
0.7
TVS Srichakra
Neutral
3,686
-
2,822
2,304
2,614
13.7
13.8
231.1
266.6
16.0
13.8
414.1
326.1
33.9
29.3
1.2
1.1
HSIL
Neutral
348
-
2,516
2,384
2,515
15.8
16.3
15.3
19.4
22.8
17.9
22.6
19.5
7.8
9.3
1.2
1.1
Kirloskar Engines India
Neutral
345
-
4,991
2,554
2,800
9.9
10.0
10.5
12.1
32.9
28.5
13.8
13.0
10.7
11.7
1.6
1.4
Ltd
M M Forgings
Neutral
453
-
547
546
608
20.4
20.7
41.3
48.7
11.0
9.3
62.1
54.9
16.6
17.0
0.8
0.8
Banco Products (India)
Neutral
222
-
1,586
1,353
1,471
12.3
12.4
14.5
16.3
15.3
13.6
21.1
19.0
14.5
14.6
1.1
119.5
Competent Automobiles Neutral
208
-
128
1,137
1,256
3.1
2.7
28.0
23.6
7.4
8.8
40.0
36.1
14.3
11.5
0.1
0.1
Stock Watch
November 01, 2016
Company Name
Reco
CMP
Target
Mkt Cap
Sales ( Čcr )
OPM(%)
EPS (Č)
PER(x)
P/BV(x)
RoE(%)
EV/Sales(x)
(Č)
Price ( Č)
( Č cr )
FY17E
FY18E
FY17E
FY18E
FY17E
FY18E
FY17E
FY18E
FY17E
FY18E
FY17E
FY18E
FY17E
FY18E
zOthers
Nilkamal
Neutral
1,635
-
2,440
1,995
2,165
10.7
10.4
69.8
80.6
23.4
20.3
93.4
81.2
16.6
16.5
1.2
1.1
Visaka Industries
Neutral
224
-
356
1,051
1,138
10.3
10.4
21.0
23.1
10.7
9.7
28.8
26.9
9.0
9.2
0.6
0.6
Transport Corporation of
Neutral
183
-
1,401
2,671
2,911
8.5
8.8
13.9
15.7
13.2
11.7
1.8
1.6
13.7
13.8
0.6
0.6
India
Elecon Engineering
Neutral
67
-
724
1,482
1,660
13.7
14.5
3.9
5.8
17.1
11.5
4.0
3.7
7.8
10.9
0.8
0.7
Surya Roshni
Neutral
240
-
1,051
3,342
3,625
7.8
7.5
17.3
19.8
13.9
12.1
26.4
21.2
10.5
10.8
0.6
0.5
MT Educare
Neutral
138
-
549
366
417
17.7
18.2
9.4
10.8
14.7
12.8
3.3
2.8
22.2
22.3
1.4
1.2
Radico Khaitan
Neutral
141
-
1,873
1,659
1,802
13.0
13.2
6.3
7.4
22.2
19.1
1.9
1.8
8.6
9.3
1.6
1.4
Garware Wall Ropes
Neutral
552
-
1,208
873
938
12.9
13.1
30.9
34.9
17.9
15.8
2.8
2.4
15.7
15.2
1.3
1.2
Wonderla Holidays
Neutral
397
-
2,243
287
355
38.0
40.0
11.3
14.2
35.1
28.0
5.0
4.4
21.4
23.9
7.5
6.1
Linc Pen & Plastics
Neutral
260
-
384
382
420
9.3
9.5
13.5
15.7
19.3
16.6
3.3
2.9
17.1
17.3
1.1
1.0
The Byke Hospitality
Neutral
181
-
725
287
384
20.5
20.5
7.6
10.7
23.8
16.9
5.0
4.0
20.7
23.5
2.5
1.9
Interglobe Aviation
Neutral
931
-
33,538
21,122
26,005
14.5
27.6
110.7
132.1
8.4
7.1
50.3
35.9
168.5
201.1
1.6
1.2
Coffee Day Enterprises
Neutral
222
-
4,574
2,964
3,260
20.5
21.2
4.7
8.0
-
27.8
2.6
2.4
5.5
8.5
2.0
1.7
Ltd
Navneet Education
Neutral
109
-
2,594
1,062
1,147
24.0
24.0
6.1
6.6
17.9
16.4
3.7
3.3
20.6
19.8
2.5
2.3
Navkar Corporation
Buy
199
265
2,843
408
612
42.9
42.3
6.8
11.5
29.4
17.3
2.0
1.8
6.9
10.5
7.9
5.3
UFO Moviez
Neutral
464
-
1,282
619
685
33.2
33.4
30.0
34.9
15.5
13.3
2.1
1.9
13.8
13.9
1.8
1.4
VRL Logistics
Neutral
289
-
2,632
1,902
2,119
16.7
16.6
14.6
16.8
19.8
17.2
4.3
3.8
21.9
22.2
1.5
1.3
Team Lease Serv.
Neutral
1,013
-
1,733
3,229
4,001
1.5
1.8
22.8
32.8
44.5
30.9
4.8
4.1
10.7
13.4
0.4
0.3
S H Kelkar & Co.
Neutral
312
-
4,506
1,036
1,160
15.1
15.0
6.1
7.2
51.0
43.4
5.5
5.0
10.7
11.5
4.2
3.7
Quick Heal
Neutral
253
-
1,774
408
495
27.3
27.0
7.7
8.8
32.7
28.8
3.0
3.0
9.3
10.6
3.5
2.9
Narayana Hrudaya
Neutral
341
-
6,971
1,873
2,166
11.5
11.7
2.6
4.0
129.0
86.0
7.9
7.1
6.1
8.3
3.8
3.3
Manpasand Bever.
Neutral
721
-
4,126
836
1,087
19.6
19.4
16.9
23.8
42.7
30.3
5.1
4.5
12.0
14.8
4.7
3.5
Parag Milk Foods
Neutral
311
-
2,618
1,919
2,231
9.3
9.6
9.5
12.9
33.0
24.1
5.1
4.2
15.5
17.5
1.5
1.3
Mirza International
Buy
93
113
1,121
1,024
1,148
18.0
18.0
6.9
8.0
13.5
11.6
2.3
1.9
16.6
16.2
1.3
1.1
Asian Granito
Buy
272
351
819
1,118
1,220
11.8
12.0
13.0
16.0
20.9
17.0
2.0
1.8
9.7
10.7
1.0
0.9
Source: Company, Angel Research; Note: *December year end; #September year end; &October year end; Price as on October 28, 2016
Market Outlook
November 01, 2016
Research Team Tel: 022 - 39357800
DISCLAIMER
Angel Broking Private Limited (hereinafter referred to as “Angel”) is a registered Member of National Stock Exchange of India
Limited,Bombay Stock Exchange Limited and Metropolitan Stock Exchange Limited. It is also registered as a Depository Participant with
CDSL and Portfolio Manager with SEBI. It also has registration with AMFI as a Mutual Fund Distributor. Angel Broking Private Limited is a
registered entity with SEBI for Research Analyst in terms of SEBI (Research Analyst) Regulations, 2014 vide registration number
INH000000164. Angel or its associates has not been debarred/ suspended by SEBI or any other regulatory authority for accessing
/dealing in securities Market. Angel or its associates/analyst has not received any compensation / managed or
co-managed public offering of securities of the company covered by Analyst during the past twelve months.
This document is solely for the personal information of the recipient, and must not be singularly used as the basis of any investment
decision. Nothing in this document should be construed as investment or financial advice. Each recipient of this document should make
such investigations as they deem necessary to arrive at an independent evaluation of an investment in the securities of the companies
referred to in this document (including the merits and risks involved), and should consult their own advisors to determine the merits and
risks of such an investment.
Reports based on technical and derivative analysis center on studying charts of a stock's price movement, outstanding positions and
trading volume, as opposed to focusing on a company's fundamentals and, as such, may not match with a report on a company's
fundamentals. Investors are advised to refer the Fundamental and Technical Research Reports available on our website to evaluate the
contrary view, if any.
The information in this document has been printed on the basis of publicly available information, internal data and other reliable
sources believed to be true, but we do not represent that it is accurate or complete and it should not be relied on as such, as this
document is for general guidance only. Angel Broking Pvt. Limited or any of its affiliates/ group companies shall not be in any way
responsible for any loss or damage that may arise to any person from any inadvertent error in the information contained in this report.
Angel Broking Pvt. Limited has not independently verified all the information contained within this document. Accordingly, we cannot
testify, nor make any representation or warranty, express or implied, to the accuracy, contents or data contained within this document.
While Angel Broking Pvt. Limited endeavors to update on a reasonable basis the information discussed in this material, there may be
regulatory, compliance, or other reasons that prevent us from doing so.
This document is being supplied to you solely for your information, and its contents, information or data may not be reproduced,
redistributed or passed on, directly or indirectly.
Neither Angel Broking Pvt. Limited, nor its directors, employees or affiliates shall be liable for any loss or damage that may arise from
or in connection with the use of this information.